| Dimension | Pair | n | Pearson | Spearman | Mean |gap| |
|---|---|---|---|---|---|
| Anti-Elitism | sonnet ↔︎ gpt41mini | 2915 | 0.806 | 0.808 | 1.05 |
| Anti-Elitism | sonnet ↔︎ gemini | 2508 | 0.813 | 0.807 | 1.05 |
| Anti-Elitism | gpt41mini ↔︎ gemini | 2582 | 0.657 | 0.662 | 1.37 |
| People-Centrism | sonnet ↔︎ gpt41mini | 3096 | 0.659 | 0.670 | 1.22 |
| People-Centrism | sonnet ↔︎ gemini | 2516 | 0.706 | 0.692 | 1.04 |
| People-Centrism | gpt41mini ↔︎ gemini | 2503 | 0.472 | 0.472 | 1.46 |
| Manichaean Worldview | sonnet ↔︎ gpt41mini | 2635 | 0.799 | 0.783 | 1.12 |
| Manichaean Worldview | sonnet ↔︎ gemini | 1840 | 0.743 | 0.743 | 1.18 |
| Manichaean Worldview | gpt41mini ↔︎ gemini | 1751 | 0.604 | 0.603 | 1.44 |
| Populism (Overall) | sonnet ↔︎ gpt41mini | 3026 | 0.785 | 0.782 | 1.14 |
| Populism (Overall) | sonnet ↔︎ gemini | 2737 | 0.836 | 0.806 | 0.93 |
| Populism (Overall) | gpt41mini ↔︎ gemini | 2729 | 0.680 | 0.672 | 1.38 |
| Ideology — Left | sonnet ↔︎ gpt41mini | 3072 | 0.857 | 0.870 | 1.34 |
| Ideology — Left | sonnet ↔︎ gemini | 1518 | 0.842 | 0.840 | 0.85 |
| Ideology — Left | gpt41mini ↔︎ gemini | 1516 | 0.664 | 0.670 | 1.07 |
| Ideology — Right | sonnet ↔︎ gpt41mini | 2725 | 0.822 | 0.756 | 1.41 |
| Ideology — Right | sonnet ↔︎ gemini | 1123 | 0.886 | 0.903 | 1.21 |
| Ideology — Right | gpt41mini ↔︎ gemini | 1102 | 0.798 | 0.799 | 1.52 |
| Ideology — Centrist | sonnet ↔︎ gpt41mini | 3090 | 0.413 | 0.395 | 3.00 |
| Ideology — Centrist | sonnet ↔︎ gemini | 1199 | 0.544 | 0.537 | 1.18 |
| Ideology — Centrist | gpt41mini ↔︎ gemini | 1193 | 0.282 | 0.226 | 2.17 |
| Ideology (Right − Left) | sonnet ↔︎ gpt41mini | 3131 | 0.661 | 0.696 | 1.56 |
| Ideology (Right − Left) | sonnet ↔︎ gemini | 2585 | 0.845 | 0.846 | 1.07 |
| Ideology (Right − Left) | gpt41mini ↔︎ gemini | 2600 | 0.573 | 0.597 | 1.58 |
| Political Liberalism | sonnet ↔︎ gpt41mini | 3129 | 0.795 | 0.686 | 0.89 |
| Political Liberalism | sonnet ↔︎ gemini | 3053 | 0.797 | 0.737 | 0.95 |
| Political Liberalism | gpt41mini ↔︎ gemini | 3212 | 0.720 | 0.631 | 0.53 |
| Social Liberalism | sonnet ↔︎ gpt41mini | 3081 | 0.845 | 0.808 | 0.82 |
| Social Liberalism | sonnet ↔︎ gemini | 2930 | 0.902 | 0.841 | 0.93 |
| Social Liberalism | gpt41mini ↔︎ gemini | 3088 | 0.807 | 0.760 | 0.72 |
| Economic Liberalism | sonnet ↔︎ gpt41mini | 2894 | 0.756 | 0.755 | 1.35 |
| Economic Liberalism | sonnet ↔︎ gemini | 2817 | 0.956 | 0.944 | 0.83 |
| Economic Liberalism | gpt41mini ↔︎ gemini | 3118 | 0.695 | 0.709 | 1.48 |
| Financial-Market Liberalism | sonnet ↔︎ gpt41mini | 2517 | 0.687 | 0.676 | 1.23 |
| Financial-Market Liberalism | sonnet ↔︎ gemini | 2540 | 0.943 | 0.942 | 0.80 |
| Financial-Market Liberalism | gpt41mini ↔︎ gemini | 2398 | 0.664 | 0.663 | 1.57 |
| Liberalism (Overall) | sonnet ↔︎ gpt41mini | 3030 | 0.747 | 0.619 | 1.06 |
| Liberalism (Overall) | sonnet ↔︎ gemini | 3044 | 0.899 | 0.864 | 0.75 |
| Liberalism (Overall) | gpt41mini ↔︎ gemini | 3308 | 0.711 | 0.600 | 0.87 |
Cross-model agreement
Where the three LLMs converge and where they diverge
Per-dimension pairwise correlations
Disagreement-flagged outliers
Manifestos where the three models disagree by more than 3 points on populism_overall:
| doc_id | Country | Party | Year | sonnet | gpt41mini | gemini | Range |
|---|---|---|---|---|---|---|---|
| 35210_198304 | Portugal | UDP | 1983 | 10.0 | 3 | 8 | 7 |
| 14110_201504 | Finland | VL | 2015 | 3.0 | 7 | 1 | 6 |
| 22320_196702 | Netherlands | PvdA | 1967 | 5.0 | 7 | 1 | 6 |
| 35310_198010 | Portugal | MDP | 1980 | 9.0 | 9 | 3 | 6 |
| 63810_198303 | Australia | NPA | 1983 | 6.0 | 7 | 1 | 6 |
| 72072_201909 | Israel | 2019 | 3.0 | 8 | 2 | 6 | |
| 11320_198209 | Sweden | SAP | 1982 | 5.0 | 7 | 2 | 5 |
| 11220_201009 | Sweden | V | 2010 | 7.0 | 8 | 3 | 5 |
| 11320_201009 | Sweden | SAP | 2010 | 6.0 | 7 | 2 | 5 |
| 11110_201409 | Sweden | MP | 2014 | 3.0 | 6 | 1 | 5 |
| 11620_202209 | Sweden | MSP | 2022 | 3.0 | 8 | 3 | 5 |
| 13230_196409 | Denmark | SF | 1964 | 5.0 | 7 | 2 | 5 |
| 13210_197312 | Denmark | VS | 1973 | 8.0 | 3 | 8 | 5 |
| 13230_198709 | Denmark | SF | 1987 | 7.0 | 8 | 3 | 5 |
| 13230_199803 | Denmark | SF | 1998 | 6.0 | 8 | 3 | 5 |
| 13229_200711 | Denmark | EL | 2007 | 7.0 | 8 | 3 | 5 |
| 13230_201906 | Denmark | SF | 2019 | 5.0 | 7 | 2 | 5 |
| 14620_197201 | Finland | KK | 1972 | 6.0 | 7 | 2 | 5 |
| 14110_200303 | Finland | VL | 2003 | 3.0 | 6 | 1 | 5 |
| 14223_201104 | Finland | VAS | 2011 | 5.0 | 8 | 3 | 5 |
| 14223_201904 | Finland | VAS | 2019 | 6.0 | 8 | 3 | 5 |
| 21320_197403 | Belgium | BSP/PSB | 1974 | 7.0 | 8 | 3 | 5 |
| 21912_197812 | Belgium | FDF | 1978 | 6.0 | 7 | 2 | 5 |
| 22310_197104 | Netherlands | PPR | 1971 | 6.0 | 7 | 2 | 5 |
| 22320_197705 | Netherlands | PvdA | 1977 | 5.0 | 7 | 2 | 5 |
| 22320_198605 | Netherlands | PvdA | 1986 | 2.3 | 7 | 2 | 5 |
| 22527_199405 | Netherlands | GPV | 1994 | 2.0 | 7 | 3 | 5 |
| 22321_201703 | Netherlands | DENK | 2017 | 2.0 | 7 | 5 | 5 |
| 31220_200206 | France | PCF | 2002 | 8.0 | 3 | 7 | 5 |
| 33430_197903 | Spain | UCD | 1979 | NA | 3 | 8 | 5 |
| 34210_200709 | Greece | KKE | 2007 | 8.0 | 3 | 8 | 5 |
| 35220_198010 | Portugal | PCP | 1980 | 9.0 | 9 | 4 | 5 |
| 35311_198304 | Portugal | PS | 1983 | 3.0 | 7 | 2 | 5 |
| 35220_198707 | Portugal | PCP | 1987 | 8.0 | 8 | 3 | 5 |
| 41320_198303 | Germany | SPD | 1983 | 4.0 | 7 | 2 | 5 |
| 43320_199110 | Switzerland | SPS/PSS | 1991 | 5.0 | 7 | 2 | 5 |
| 43220_200310 | Switzerland | PdAS/PdTS | 2003 | 8.0 | 3 | 7 | 5 |
| 51420_196603 | United Kingdom | 1966 | 4.0 | 7 | 2 | 5 | |
| 51320_197905 | United Kingdom | Labour | 1979 | 5.0 | 7 | 2 | 5 |
| 51420_198306 | United Kingdom | 1983 | NA | 7 | 2 | 5 |
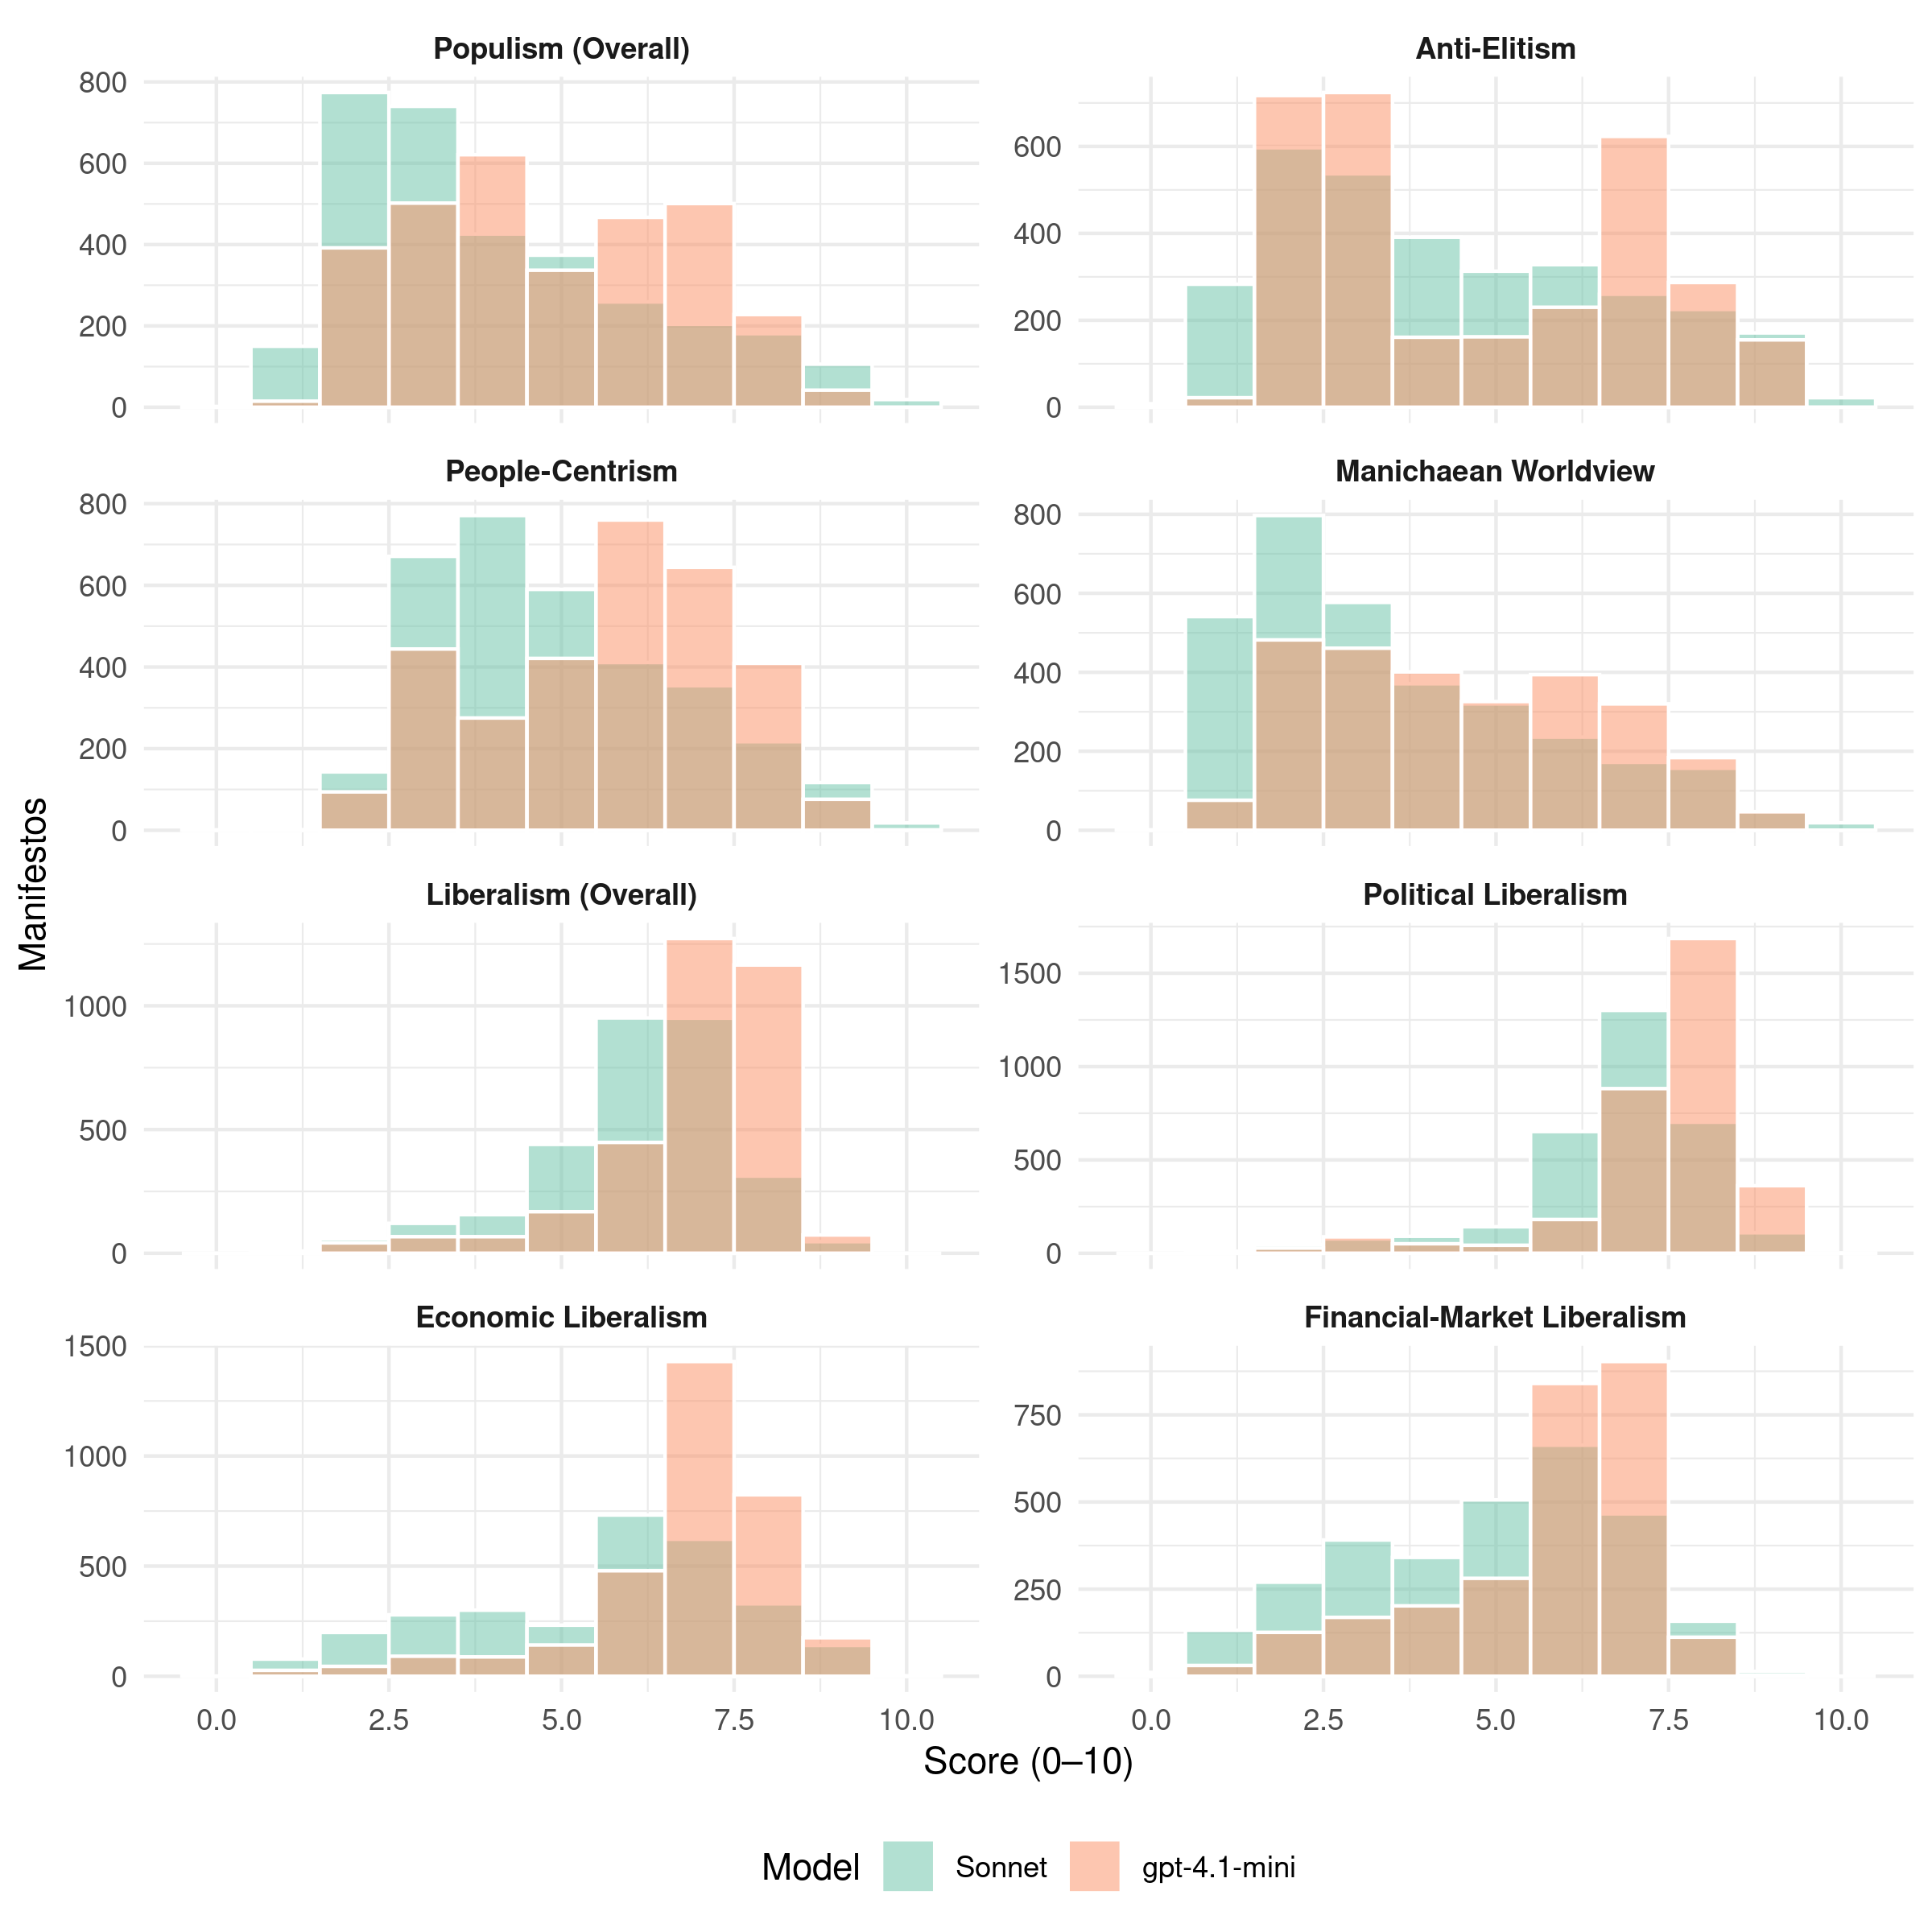
Score distribution by model