R Code to download Datasets from Kenneth French’s famous website.
What’s new
Version 1.2.0 (development) adds three convenience functions and several quality-of-life improvements while remaining fully backward compatible:
| Function | What it does |
|---|---|
FFget() |
Download one dataset and return it directly — no file I/O required |
FFlist() |
Browse all available datasets as a tidy data frame |
FFmatch() |
Preview fuzzy-match results before triggering a download |
FFdownload() |
Now accepts na_values, return_data, action, cache_days, match_threshold
|
All existing FFdownload() calls continue to work without any changes.
Version 1.1.1 corrects a small error for publication on CRAN.
Motivation
One often needs those datasets for further empirical work and it is a tedious effort to download the (zipped) csv, open and then manually separate the contained datasets. This package downloads them automatically, and converts them to a list of xts-objects (or tibbles) that contain all the information from the csv-files.
Contributors
Original code from MasimovR https://github.com/MasimovR/. Was then heavily redacted by me.
Installation
You can install the stable release of FFdownload from CRAN with:
install.packages("FFdownload")Install the development version (v1.2.0) from GitHub with:
# install.packages("devtools")
devtools::install_github("sstoeckl/FFdownload@dev")
Examples
Example 0: One-liner with FFget() (new in v1.2.0)
FFget() is the fastest way to get a single dataset into your session. No intermediate file, no load() call, and missing values (-99, -999, -99.99) are replaced with NA by default.
# Get the FF 5-factor monthly data directly as a tibble
ff5 <- FFget("F-F_Research_Data_5_Factors_2x3", subtable = "Temp2")
#> Step 1: getting list of all the csv-zip-files!
#> Step 2: Downloading 1 zip-files
#> Step 3: Start processing 1 csv-files
#>   |                                                                              |                                                                      |   0%  |                                                                              |======================================================================| 100%
#> Be aware that as of version 1.0.6 the saved object is named FFdata rather than FFdownload to not be confused with the corresponding command!
head(ff5)
#> # A tibble: 6 × 7
#>   date      Mkt.RF   SMB   HML   RMW   CMA    RF
#>   <yearmon>  <dbl> <dbl> <dbl> <dbl> <dbl> <dbl>
#> 1 Jul 1963   -0.39 -0.48 -0.81  0.64 -1.15  0.27
#> 2 Aug 1963    5.08 -0.8   1.7   0.4  -0.38  0.25
#> 3 Sep 1963   -1.57 -0.43  0    -0.78  0.15  0.27
#> 4 Okt 1963    2.54 -1.34 -0.04  2.79 -2.25  0.29
#> 5 Nov 1963   -0.86 -0.85  1.73 -0.43  2.27  0.27
#> 6 Dez 1963    1.83 -1.89 -0.21  0.12 -0.25  0.29
ff5 |>
  tidyr::pivot_longer(cols = -date, names_to = "FFFactors", values_to = "Value") |>
  group_by(FFFactors) |> mutate(Price = cumprod(1 + Value / 100)) |>
  ggplot2::ggplot(aes(x = date, col = FFFactors, y = Price)) +
  geom_line(lwd = 1.2) + theme_bw() + theme(legend.position = "bottom")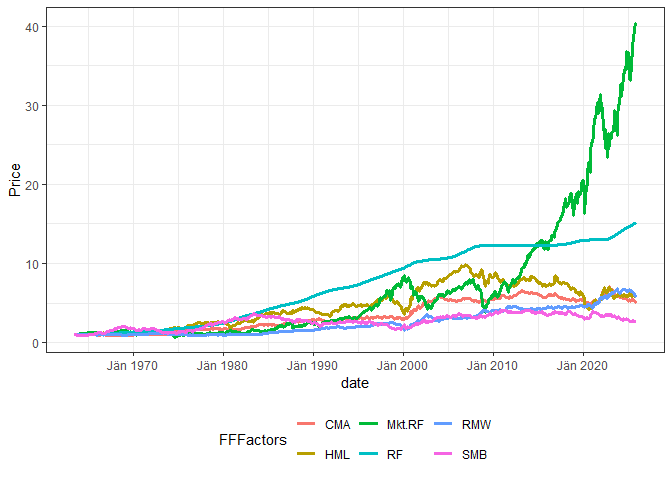
For bulk downloads, reproducible snapshots, or xts output, see Examples 1–3 below.
Dataset Discovery with FFlist() and FFmatch() (new in v1.2.0)
Before downloading, you can browse all available datasets and verify that your search strings match the intended files.
# All non-daily datasets as a tidy data frame (tibble)
fl <- FFlist()
nrow(fl)        # typically 100+ datasets
#> [1] 193
head(fl, 8)
#> # A tibble: 8 × 2
#>   name                                file_url
#>   <chr>                               <chr>
#> 1 F-F_Research_Data_Factors           https://mba.tuck.dartmouth.edu/pages/facu…
#> 2 F-F_Research_Data_Factors_weekly    https://mba.tuck.dartmouth.edu/pages/facu…
#> 3 F-F_Research_Data_5_Factors_2x3     https://mba.tuck.dartmouth.edu/pages/facu…
#> 4 Portfolios_Formed_on_ME             https://mba.tuck.dartmouth.edu/pages/facu…
#> 5 Portfolios_Formed_on_ME_Wout_Div    https://mba.tuck.dartmouth.edu/pages/facu…
#> 6 Portfolios_Formed_on_BE-ME          https://mba.tuck.dartmouth.edu/pages/facu…
#> 7 Portfolios_Formed_on_BE-ME_Wout_Div https://mba.tuck.dartmouth.edu/pages/facu…
#> 8 Portfolios_Formed_on_OP             https://mba.tuck.dartmouth.edu/pages/facu…
# Filter with dplyr
library(dplyr)
FFlist() |> filter(grepl("Momentum|Reversal", name))
#> # A tibble: 3 × 2
#>   name                   file_url
#>   <chr>                  <chr>
#> 1 F-F_Momentum_Factor    https://mba.tuck.dartmouth.edu/pages/faculty/ken.frenc…
#> 2 F-F_ST_Reversal_Factor https://mba.tuck.dartmouth.edu/pages/faculty/ken.frenc…
#> 3 F-F_LT_Reversal_Factor https://mba.tuck.dartmouth.edu/pages/faculty/ken.frenc…
FFmatch() shows exactly which file each search string would be matched to, including a similarity score (below 0.3 = possibly wrong match):
FFmatch(c("Research_Data_Factors", "Momentum", "ST_Reversal", "zzz"))
#> # A tibble: 4 × 4
#>   requested             matched                           edit_distance similarity
#>   <chr>                 <chr>                                     <int>      <dbl>
#> 1 Research_Data_Factors F-F_Research_Data_Factors                     3      0.87
#> 2 Momentum              F-F_Momentum_Factor                           9      0.44
#> 3 ST_Reversal           F-F_ST_Reversal_Factor                       10      0.42
#> 4 zzz                   F-F_Research_Data_Factors                    22      0.11  ← low!
Example 1: Multi-dataset bulk download (classic API)
The classic workflow downloads multiple datasets in one call and saves them to an .RData snapshot — ideal for reproducible research.
Step 1: Browse available datasets
temptxt <- tempfile(fileext = ".txt")
FFdownload(exclude_daily=TRUE, download=FALSE, download_only=TRUE, listsave=temptxt)
FFlist_old <- readr::read_csv(temptxt) %>% dplyr::select(2) %>% dplyr::rename(Files=x)
FFlist_old %>% dplyr::slice(1:3, (dplyr::n()-2):dplyr::n())
#> # A tibble: 6 × 1
#>   Files
#>   <chr>
#> 1 F-F_Research_Data_Factors_CSV.zip
#> 2 F-F_Research_Data_Factors_weekly_CSV.zip
#> 3 F-F_Research_Data_Factors_daily_CSV.zip
#> 4 Emerging_Markets_4_Portfolios_BE-ME_OP_CSV.zip
#> 5 Emerging_Markets_4_Portfolios_OP_INV_CSV.zip
#> 6 Emerging_Markets_4_Portfolios_BE-ME_INV_CSV.zip
Step 2: Download selected datasets
The action parameter (new in v1.2.0) is a readable alternative to download=TRUE, download_only=TRUE:
tempd <- tempdir()
inputlist <- c("F-F_Research_Data_Factors","F-F_Momentum_Factor","F-F_ST_Reversal_Factor","F-F_LT_Reversal_Factor")
# Classic syntax (still works):
FFdownload(exclude_daily=TRUE, tempd=tempd, download=TRUE, download_only=TRUE, inputlist=inputlist)
# Equivalent new syntax:
# FFdownload(exclude_daily=TRUE, tempd=tempd, action="download_only", inputlist=inputlist)
Step 3: Process downloaded files
tempf <- paste0(tempd,"\\FFdata.RData")
FFdownload(output_file = tempf, exclude_daily=TRUE, tempd=tempd, download=FALSE,
           download_only=FALSE, inputlist=inputlist, format="tbl")
#>   |                                                                              |                                                                      |   0%  |                                                                              |==================                                                    |  25%  |                                                                              |===================================                                   |  50%  |                                                                              |====================================================                  |  75%  |                                                                              |======================================================================| 100%
return_data = TRUE (new in v1.2.0) lets you skip the load() step:
FFdata <- FFdownload(output_file = tempf, exclude_daily=TRUE, tempd=tempd,
                     download=FALSE, download_only=FALSE, inputlist=inputlist,
                     format="tbl", return_data=TRUE)
Step 4: Inspect and join monthly data
library(timetk)
load(file = tempf)
FFdata$`x_F-F_Research_Data_Factors`$monthly$Temp2 %>%
  left_join(FFdata$`x_F-F_Momentum_Factor`$monthly$Temp2, by="date") %>%
  left_join(FFdata$`x_F-F_LT_Reversal_Factor`$monthly$Temp2, by="date") %>%
  left_join(FFdata$`x_F-F_ST_Reversal_Factor`$monthly$Temp2, by="date") %>% head()
#> # A tibble: 6 × 8
#>   date      Mkt.RF   SMB   HML    RF   Mom LT_Rev ST_Rev
#>   <yearmon>  <dbl> <dbl> <dbl> <dbl> <dbl>  <dbl>  <dbl>
#> 1 Jul 1926    2.89 -2.55 -2.39  0.22    NA     NA  -1.76
#> 2 Aug 1926    2.64 -1.14  3.81  0.25    NA     NA   1.43
#> 3 Sep 1926    0.38 -1.36  0.05  0.23    NA     NA  -0.07
#> 4 Okt 1926   -3.27 -0.14  0.82  0.32    NA     NA  -2.03
#> 5 Nov 1926    2.54 -0.11 -0.61  0.31    NA     NA   0.98
#> 6 Dez 1926    2.62 -0.07  0.06  0.28    NA     NA   1.95
Step 5: Annual data
FFfive <- FFdata$`x_F-F_Research_Data_Factors`$annual$`annual_factors:_january-december` %>%
  left_join(FFdata$`x_F-F_Momentum_Factor`$annual$`january-december`, by="date") %>%
  left_join(FFdata$`x_F-F_LT_Reversal_Factor`$annual$`january-december`, by="date") %>%
  left_join(FFdata$`x_F-F_ST_Reversal_Factor`$annual$`january-december`, by="date")
FFfive %>% head()
#> # A tibble: 6 × 8
#>   date      Mkt.RF    SMB    HML    RF   Mom LT_Rev ST_Rev
#>   <yearmon>  <dbl>  <dbl>  <dbl> <dbl> <dbl>  <dbl>  <dbl>
#> 1 Dez 1927    29.4  -2.2   -4.58  3.12  24.4  NA    -18.7
#> 2 Dez 1928    35.6   3.73  -5.26  3.56  26.5  NA     -8.82
#> 3 Dez 1929   -19.6 -30.7   11.9   4.75  19.7  NA    -15.0
#> 4 Dez 1930   -31.1  -5.53 -11.8   2.41  24.1  NA     -1.18
#> 5 Dez 1931   -44.8   3.07 -13.7   1.07  23.3  -4.62  27.2
#> 6 Dez 1932    -9.6   5.03  11.7   0.96 -20.6  14.1   27.9
Step 6: Wealth index plot
FFfive %>%
  pivot_longer(Mkt.RF:ST_Rev, names_to="FFVar", values_to="FFret") %>%
  mutate(FFret=FFret/100, date=as.Date(date)) %>%
  filter(date>="1960-01-01", !FFVar=="RF") %>%
  group_by(FFVar) %>% arrange(FFVar, date) %>%
  mutate(FFret=ifelse(date=="1960-01-01",1,FFret), FFretv=cumprod(1+FFret)-1) %>%
  ggplot(aes(x=date, y=FFretv, col=FFVar, type=FFVar)) + geom_line(lwd=1.2) +
  scale_y_log10() +
  labs(title="FF5 Factors plus Momentum", subtitle="Cumulative wealth plots",
       ylab="cum. returns") +
  scale_colour_viridis_d("FFvar") +
  theme_bw() + theme(legend.position="bottom")
#> Ignoring unknown labels:
#> • ylab : "cum. returns"
#> Warning in transformation$transform(x): NaNs wurden erzeugt
#> Warning in scale_y_log10(): log-10 transformation introduced infinite values.
#> Warning: Removed 11 rows containing missing values or values outside the scale range
#> (`geom_line()`).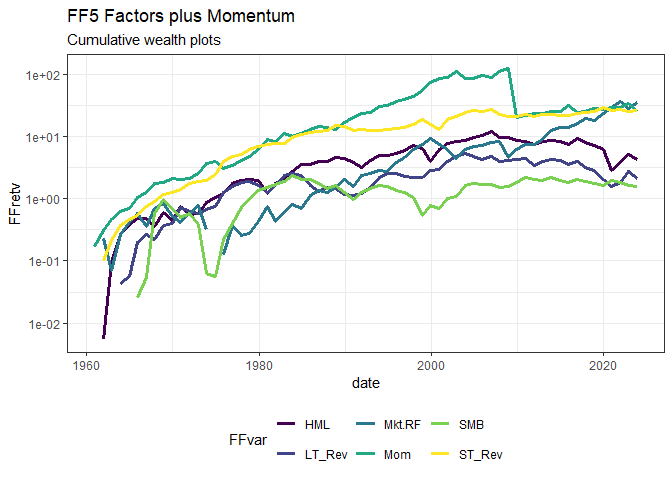
Output data structure
FFdownload() and FFget() return a nested list:
FFdata
└── x_F-F_Research_Data_Factors        # one entry per dataset (x_ prefix avoids R name issues)
    ├── monthly
    │   ├── Temp2                       # main factor returns table (unnamed sections → TempN)
    │   └── ...                         # other sub-tables if present
    ├── annual
    │   └── annual_factors:_january-december
    └── daily                           # empty list unless exclude_daily = FALSE
The most commonly used sub-table in factor files is Temp2. Use names(FFdata[["x_..."]]$monthly) to discover all available sub-table names for a given dataset.
Author/License
- Sebastian Stöckl - Package Creator, Modifier & Maintainer - sstoeckl on github and academic website
This project is licensed under the MIT License - see the license.md file for details.
Acknowledgment
I am grateful to Kenneth French for providing all this great research data on his website! Our lives would be so much harder without this boost for productivity. I am also grateful for the kind conversation with Kenneth with regard to this package: He appreciates my work on this package giving others easier access to his data sets!