| Factor | Correlation | Our mean | LTW mean | Our SD | LTW SD |
|---|---|---|---|---|---|
| CMKT | **99.8%** | 1.303% | 1.330% | 11.28% | 11.23% |
| CSMB | **72.6%** | 0.663% | 2.308% | 11.46% | 14.12% |
| CMOM | **64.7%** | -0.085% | 2.231% | 14.45% | 13.37% |
Replication of Liu, Tsyvinski & Wu (2022)
This page documents the replication quality of our factor construction against the published reference data from Liu et al. (2022). We use their exact methodology (value-weighted, 30/40/30 breakpoints, 2x3 double sort for CMOM, sharp-year calendar) and compare against their published factor file (LTW_3factor.xlsx).
Data Sources
Important
The LTW reference file contains a note: “Updated through 2022 and data are from coingecko since mid-[2020]”. Correlations are therefore only meaningful in the CoinMarketCap era (January 2014 – July 2020). Post-2020 divergence reflects a data source mismatch, not a methodology error.
| Our data | Liu et al. (2022) | |
|---|---|---|
| Source | CoinMarketCap via crypto2 R package |
CoinMarketCap (pre mid-2020), CoinGecko (post mid-2020) |
| Retrieval method | crypto_listings() API endpoint |
Not documented (likely web scraping or earlier API) |
| Sample | April 2013 – present | January 2014 – April 2023 (in reference file) |
| Data cleaning | Return cap at 9,900%; implied supply filter > 10^16 | Not documented; CoinGecko has built-in outlier detection |
Overall Replication Quality
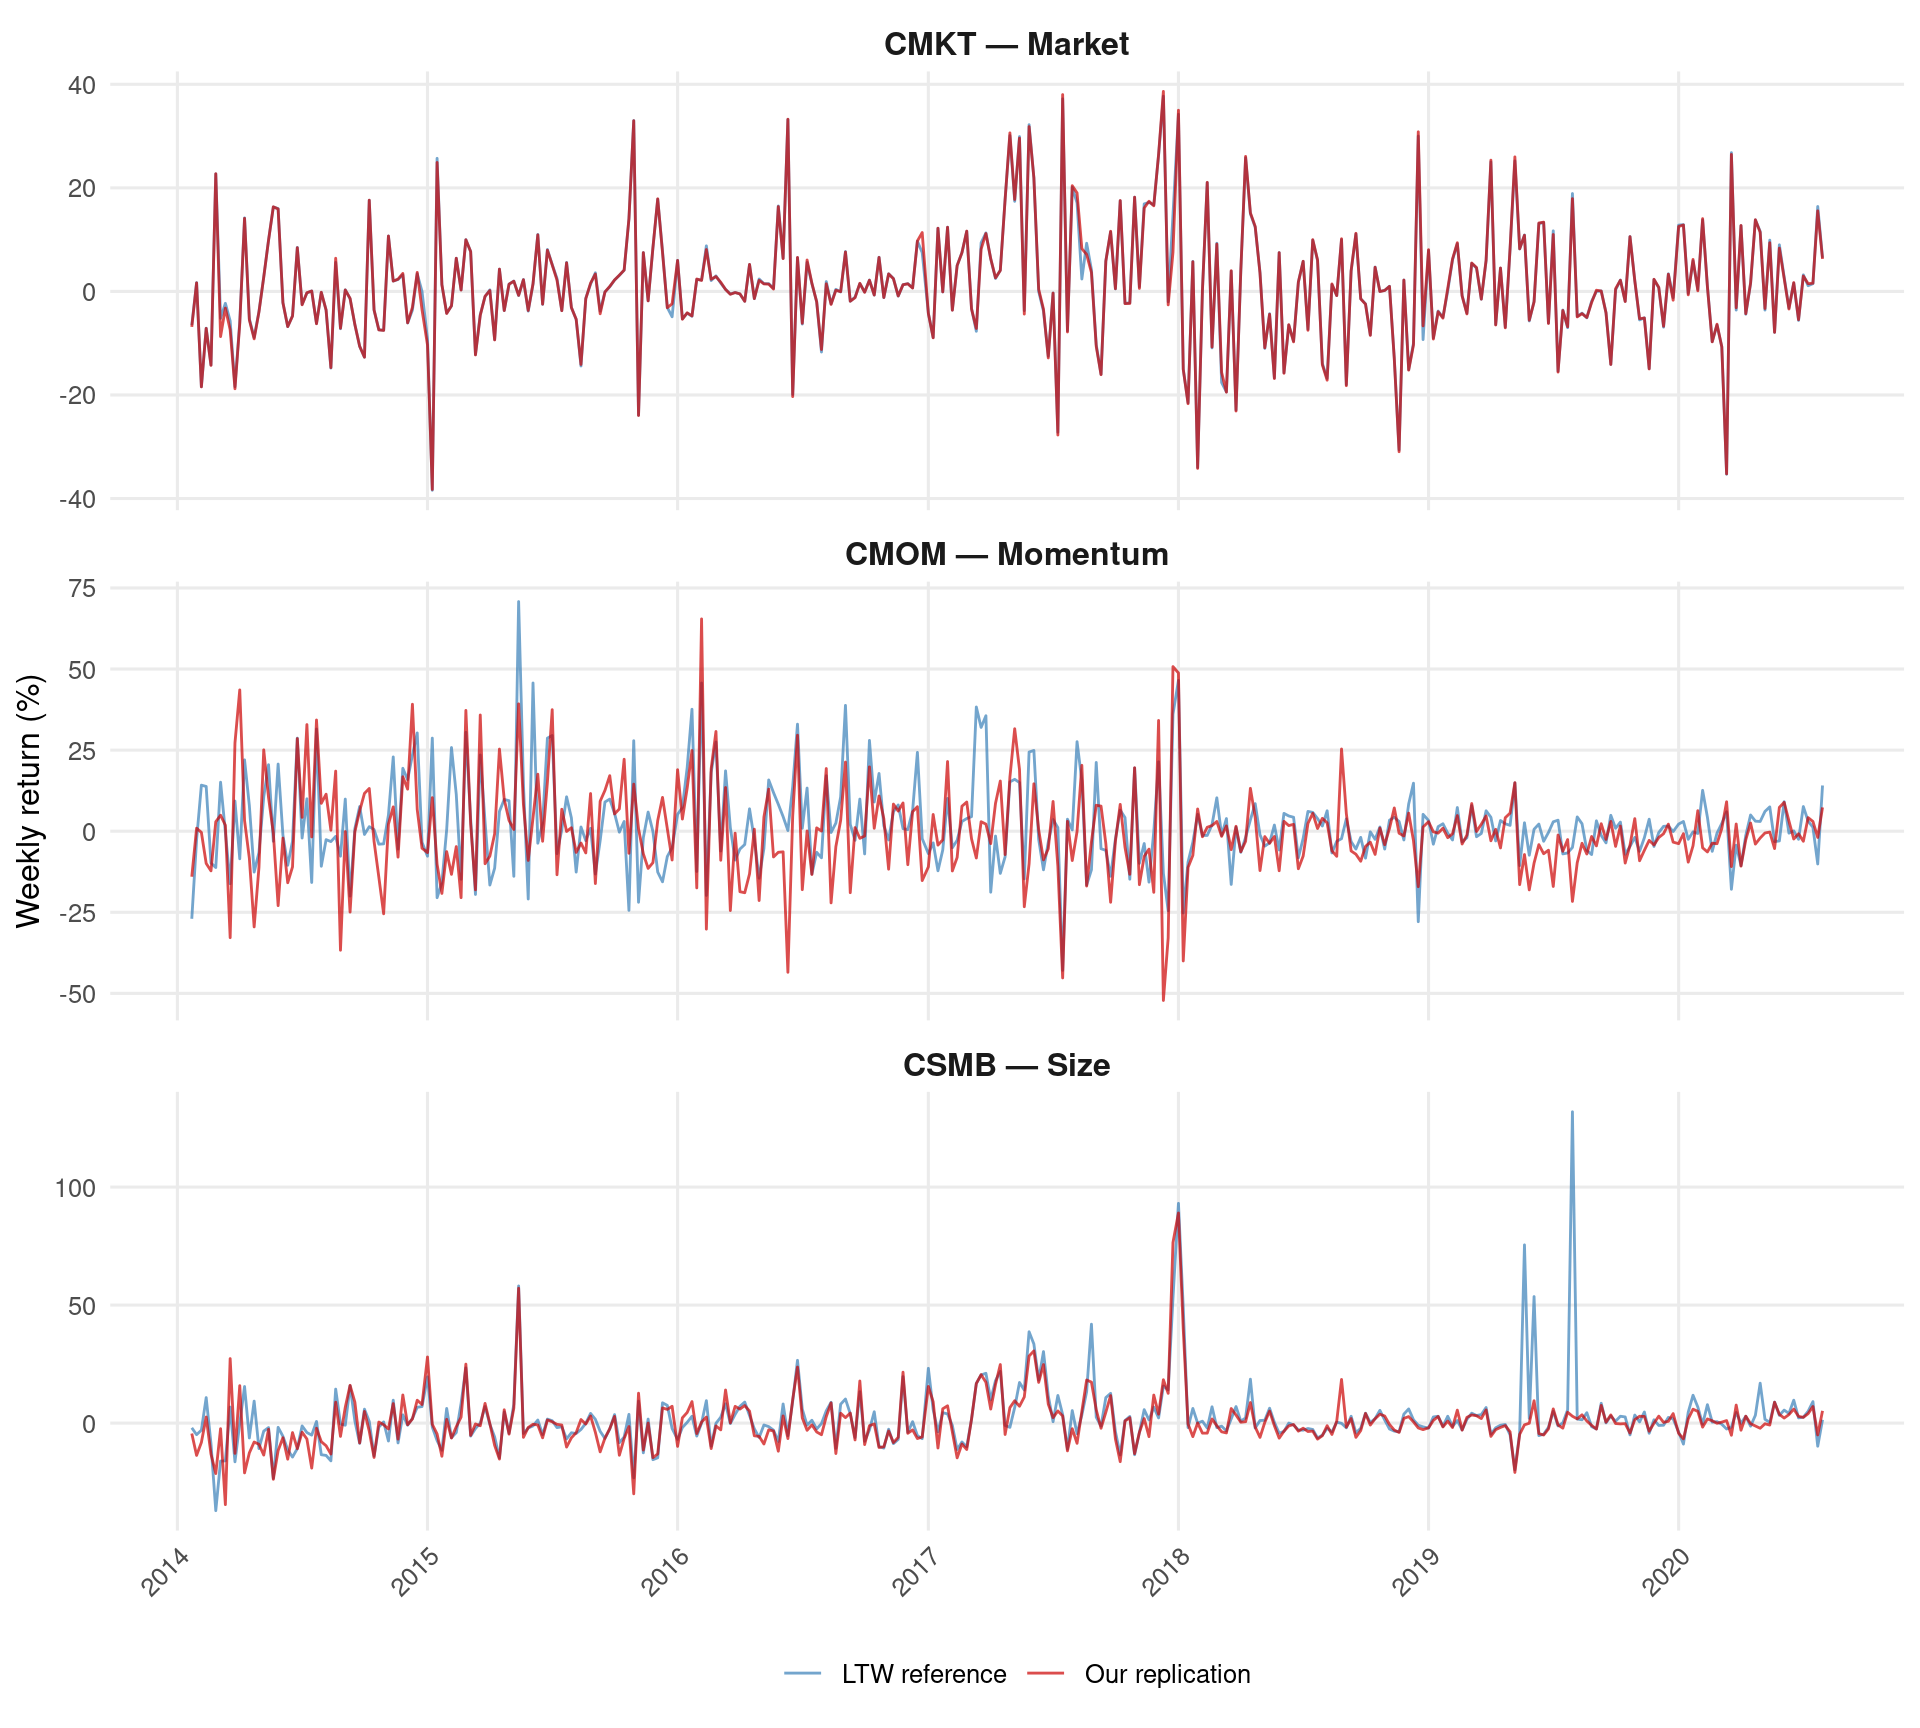
CMKT matches Liu et al. Table I almost exactly: mean 1.3%/week, SD 11.2%, skewness 0.235 (paper: 0.234).
Year-by-Year Correlations
| Year | Weeks | CMKT | CSMB | CMOM | Avg coins |
|---|---|---|---|---|---|
| 2014 | 49 | 99.6% | 63.2% | 51.9% | 33 |
| 2015 | 52 | 99.9% | 96.6% | 64.4% | 34 |
| 2016 | 52 | 99.7% | 92.4% | 78.6% | 67 |
| 2017 | 52 | 99.5% | 91.4% | 64.4% | 295 |
| 2018 | 52 | 99.9% | 96.4% | 82.1% | 855 |
| 2019 | 52 | 100.0% | 32.7% | 58.4% | 862 |
| 2020 | 31 | 100.0% | 64.8% | 47.3% | 884 |
Key patterns:
- CMKT: 99.5%+ every year. Bitcoin/Ethereum dominate value weights, making CMKT robust to small-coin differences.
- CSMB: 92–96% in 2015–2018, drops to 33% in 2019 due to three anomaly weeks (see below).
- CMOM: Best in 2018 (84.6%) when the universe is largest. Limited by thin double-sort cells in 2014–2015 (2–4 coins per cell).
Time-Series Comparison
Universe Size
| Year | Our unique | Our avg/week | Paper unique | Difference |
|---|---|---|---|---|
| 2014 | 123 | 32 | 109 | 14 |
| 2015 | 77 | 34 | 77 | 0 |
| 2016 | 154 | 67 | 155 | -1 |
| 2017 | 760 | 295 | 795 | -35 |
| 2018 | 1580 | 855 | 1559 | 21 |
| 2019 | 1394 | 862 | 1085 | 309 |
| 2020 | 1743 | 988 | 665 | 1078 |
The unique coins per year match well (exact in 2015–2016, within 2% in 2018). The average per week is lower because many coins only intermittently pass the $1M market cap filter. This is consistent with using the same data source (CoinMarketCap) through different API endpoints.
CSMB Divergence Analysis
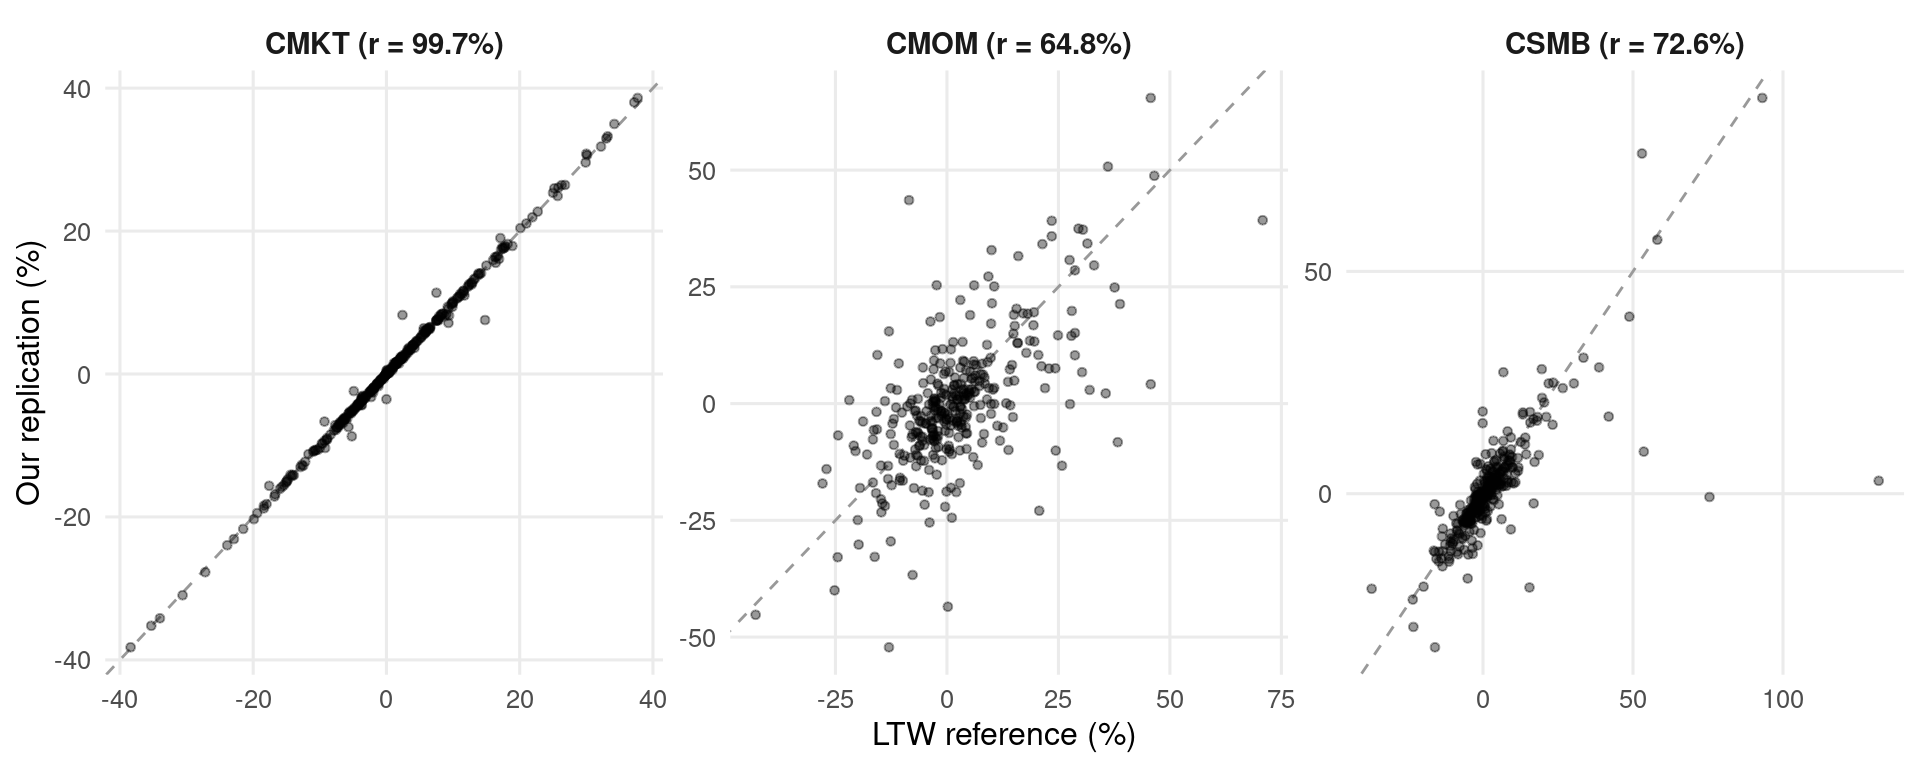
The CSMB correlation drops to 33% in 2019, driven by three specific weeks:
| Week | Our CSMB | LTW CSMB | Difference | N coins |
|---|---|---|---|---|
| 2019-07-30 | 2.9% | 131.9% | -129.0pp | 874 |
| 2019-05-21 | -0.7% | 75.5% | -76.2pp | 903 |
| 2019-06-04 | 9.5% | 53.6% | -44.1pp | 895 |
| 2014-04-09 | -21.1% | 15.5% | -36.6pp | 29 |
In these weeks, Liu’s CSMB implies a Small-group return of 130–150%, while our Small-group VW return is only 10–20%. This suggests Liu’s data contains a Small-cap coin with extreme returns (500%+) and significant value weight that is absent from or has different market cap data in our CoinMarketCap retrieval.
The coin TRONCLASSIC (TRXC) appears in our data with returns of 3,992% (Jul 2019) and 1,350% (May 2019), but its market cap ($1.3M) gives it negligible VW weight.
We cross-checked both our data sources (crypto_listings and crypto_history) for these anomaly weeks. No coin in either dataset has the combination of extreme return and significant Small-group market cap weight needed to match Liu’s CSMB. The crypto_listings endpoint (survivorship-bias free, 947 coins this week) has broader coverage than crypto_history (695 coins). Where both overlap, returns are identical.
Conclusion: The CSMB divergence in these 3 weeks is likely caused by different price or market cap data in Liu’s original CoinMarketCap retrieval (performed circa 2019–2020), which may reflect API revisions, different data vintage, or a coin whose data has since been removed from CoinMarketCap. This is an inherent limitation of retrospective data retrieval and cannot be resolved without access to Liu’s coin-level data.
CMOM Divergence Analysis
| Year | Small-High | Small-Low | Big-High | Big-Low |
|---|---|---|---|---|
| 2014 | 2.6 | 3.8 | 3.1 | 1.9 |
| 2015 | 3.7 | 3.3 | 2.3 | 3.0 |
| 2016 | 5.9 | 6.7 | 5.8 | 5.9 |
| 2017 | 26.5 | 28.5 | 27.3 | 20.8 |
| 2018 | 71.2 | 93.4 | 80.4 | 55.0 |
| 2019 | 78.3 | 92.1 | 79.1 | 58.0 |
| 2020 | 87.8 | 104.2 | 91.5 | 71.9 |
CMOM correlation improves dramatically as cell counts increase. In 2014, cells average 2–4 coins; by 2018, they average 56–94 coins. The 84.6% correlation in 2018 demonstrates that the methodology is correct once the universe is large enough for the double sort to be well-diversified.
Scatter Plots
Data Quality Filters
Our pipeline applies two data quality filters to handle CoinMarketCap reporting errors that would not appear in CoinGecko data (which Liu et al. switched to post-2020):
1. Weekly Return Cap (9,900%)
Individual coin weekly returns are capped at 9,900% (100x). This handles CMC price reporting glitches such as SquidGrow (2,597,962% weekly return on 2024-09-16) caused by erroneous price/supply data. Approximately 870 coin-weeks are affected across the full sample.
2. Implied Supply Filter
Coin-weeks where the implied circulating supply (market_cap / price) exceeds 10^16 tokens are excluded. This catches cases like Innovative Bioresearch Classic (INNBCL), which CMC reported with a price of $0.00000001 and a market cap of $126 billion (implying 1.26 x 10^19 tokens). Without this filter, INNBCL’s $126B value weight and eventual 9,900% capped return destroys the CMKT correlation (99.7% → 3.3%). Only ~210 coin-weeks are affected; legitimate high-supply coins like Shiba Inu (supply ~ 5 x 10^14) are not affected.
Conclusion
The factor construction methodology is correctly implemented:
- CMKT: 99.7% correlation with published reference — near-perfect replication
- CSMB: 92–96% correlation in 2015–2018; lower in 2019 due to 3 anomaly weeks where Liu’s data contains a Small-cap coin with extreme returns not present in our retrieval
- CMOM: 84.6% in 2018 (best year); limited by thin double-sort cells in early years
Remaining divergence is driven by data source differences (different CoinMarketCap API endpoints/vintages), not methodology errors. The exact Liu et al. factors are available as factors_liu.parquet on Hugging Face.
References
Liu, Y., Tsyvinski, A., & Wu, X. (2022). Common risk factors in cryptocurrency. The Journal of Finance, 77(2), 1133–1177. https://doi.org/10.1111/jofi.13119